Your TAM Is a Spreadsheet Fantasy
Every healthcare AI pitch deck has a $40B TAM slide. Almost none of them can name the 200 accounts that actually have the problem. Claims data can.
Healthcare go-to-market strategy has a peculiar disease: the top-down TAM. Take a market estimate, multiply by an adoption assumption, divide by nothing, and present the result to investors as if it were a plan. The number is always enormous. It is also operationally useless. It tells you nothing about which buyers to call, in what order, with what message, at what price.
Meanwhile, the most granular commercial dataset in any industry is sitting in plain sight. Every encounter, procedure, denial, prior authorization, and payment in U.S. healthcare leaves a claims trail. For a vendor selling into payers or providers, that trail answers the only GTM questions that matter: who actually has the problem you solve, how badly, and can you reach them before your runway ends?
This post lays out how to replace the TAM slide with a bottom-up, claims-derived target market, and how to turn it into an account list your sales team can execute against on Monday.
Why top-down sizing fails in healthcare specifically
Top-down TAM is weak everywhere, but healthcare punishes it uniquely.
The problem is unevenly distributed. If you automate denial appeals, your market is not "all hospitals." Initial denial rates vary severalfold across organizations, and within an organization they concentrate in specific payers and service lines. A meaningful share of your theoretical market has a denial problem too small to justify your price. Averages hide this; claims data exposes it.
Buying capacity is unevenly distributed. Thin-margin community hospitals and consolidated academic systems inhabit the same "hospital" row in a market report but have completely different budgets, committee structures, and risk tolerance. Aggregate spend figures blend buyers who will never buy with buyers who are already shopping.
The channel defines the market. In healthcare, who processes the transaction often matters more than who suffers the problem. If your product intervenes at the clearinghouse, the EHR, or the payer portal, your reachable market is bounded by those rails, a constraint no top-down number captures.
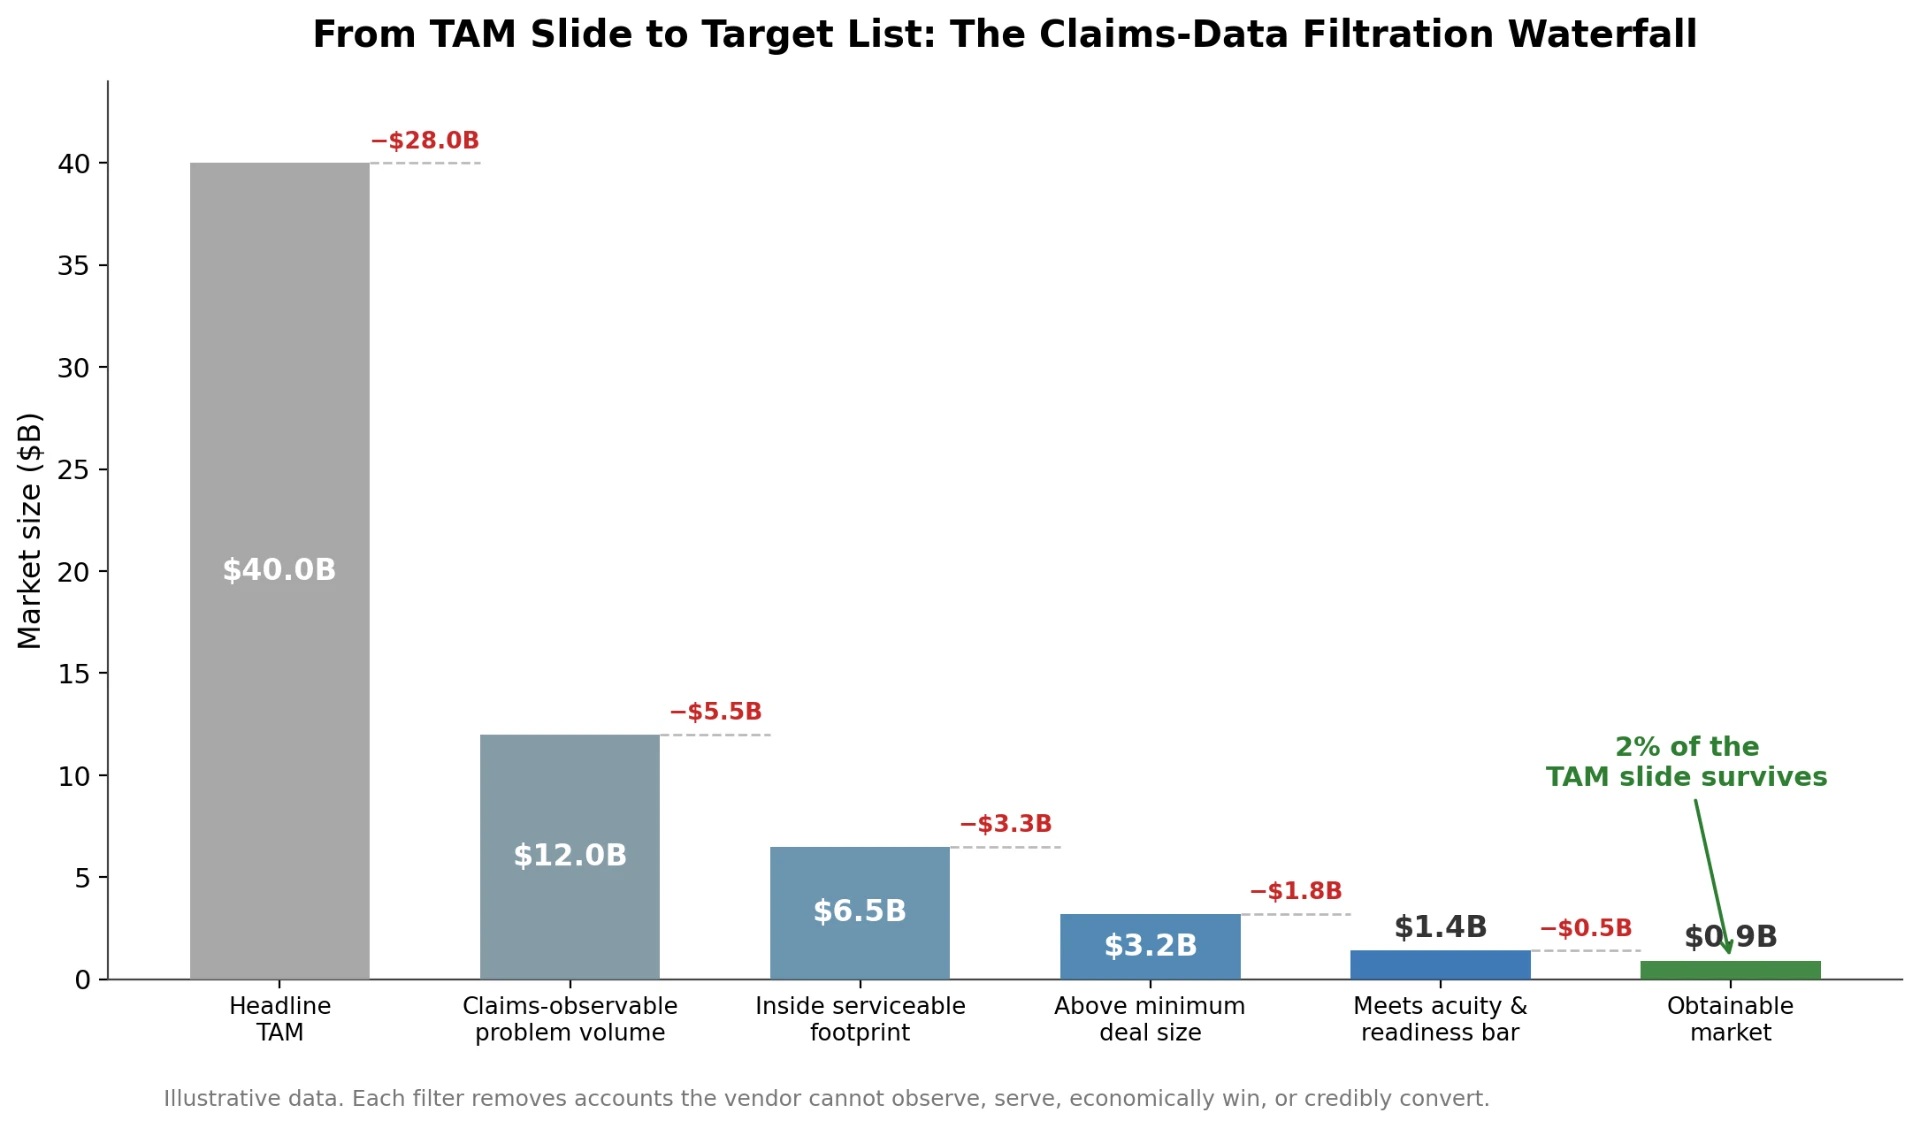
Two vendors with identical $40B TAM slides can have true, reachable, near-term markets that differ by 20x. Investors are learning to ask which one you are. You should know before they ask.
The bottom-up build: from claims universe to account list
The method is a filtration exercise. Start with the claims universe relevant to your intervention and successively remove everything you cannot serve, reach, or win. What survives is your real market: smaller, but real.
1. Define the unit of value in claims terms
Translate your product into a countable claims event: a denied claim in a recoverable category, a prior auth for a target procedure set, an avoidable ED visit, an E/M code at risk of downcoding. If your value proposition cannot be expressed as a claims-observable event, that itself is a GTM red flag, you will struggle to prove ROI for the same reason you struggle to size the market.
2. Count the events, by account
Using all-payer claims databases, CMS public files, state APCDs, or licensed commercial claims data, count your unit of value per provider organization or payer. This yields a ranked list of institutions by problem volume, the skeleton of your target market.
3. Apply serviceability filters
Remove accounts outside your integration footprint (wrong EHR, wrong clearinghouse, wrong state for your licensure), below your minimum viable deal size, or structurally unable to buy: systems in active M&A, or captive to a competitor's platform. Be ruthless. Every account that survives this filter should be one you could technically deploy into this year.
4. Score for acuity and readiness
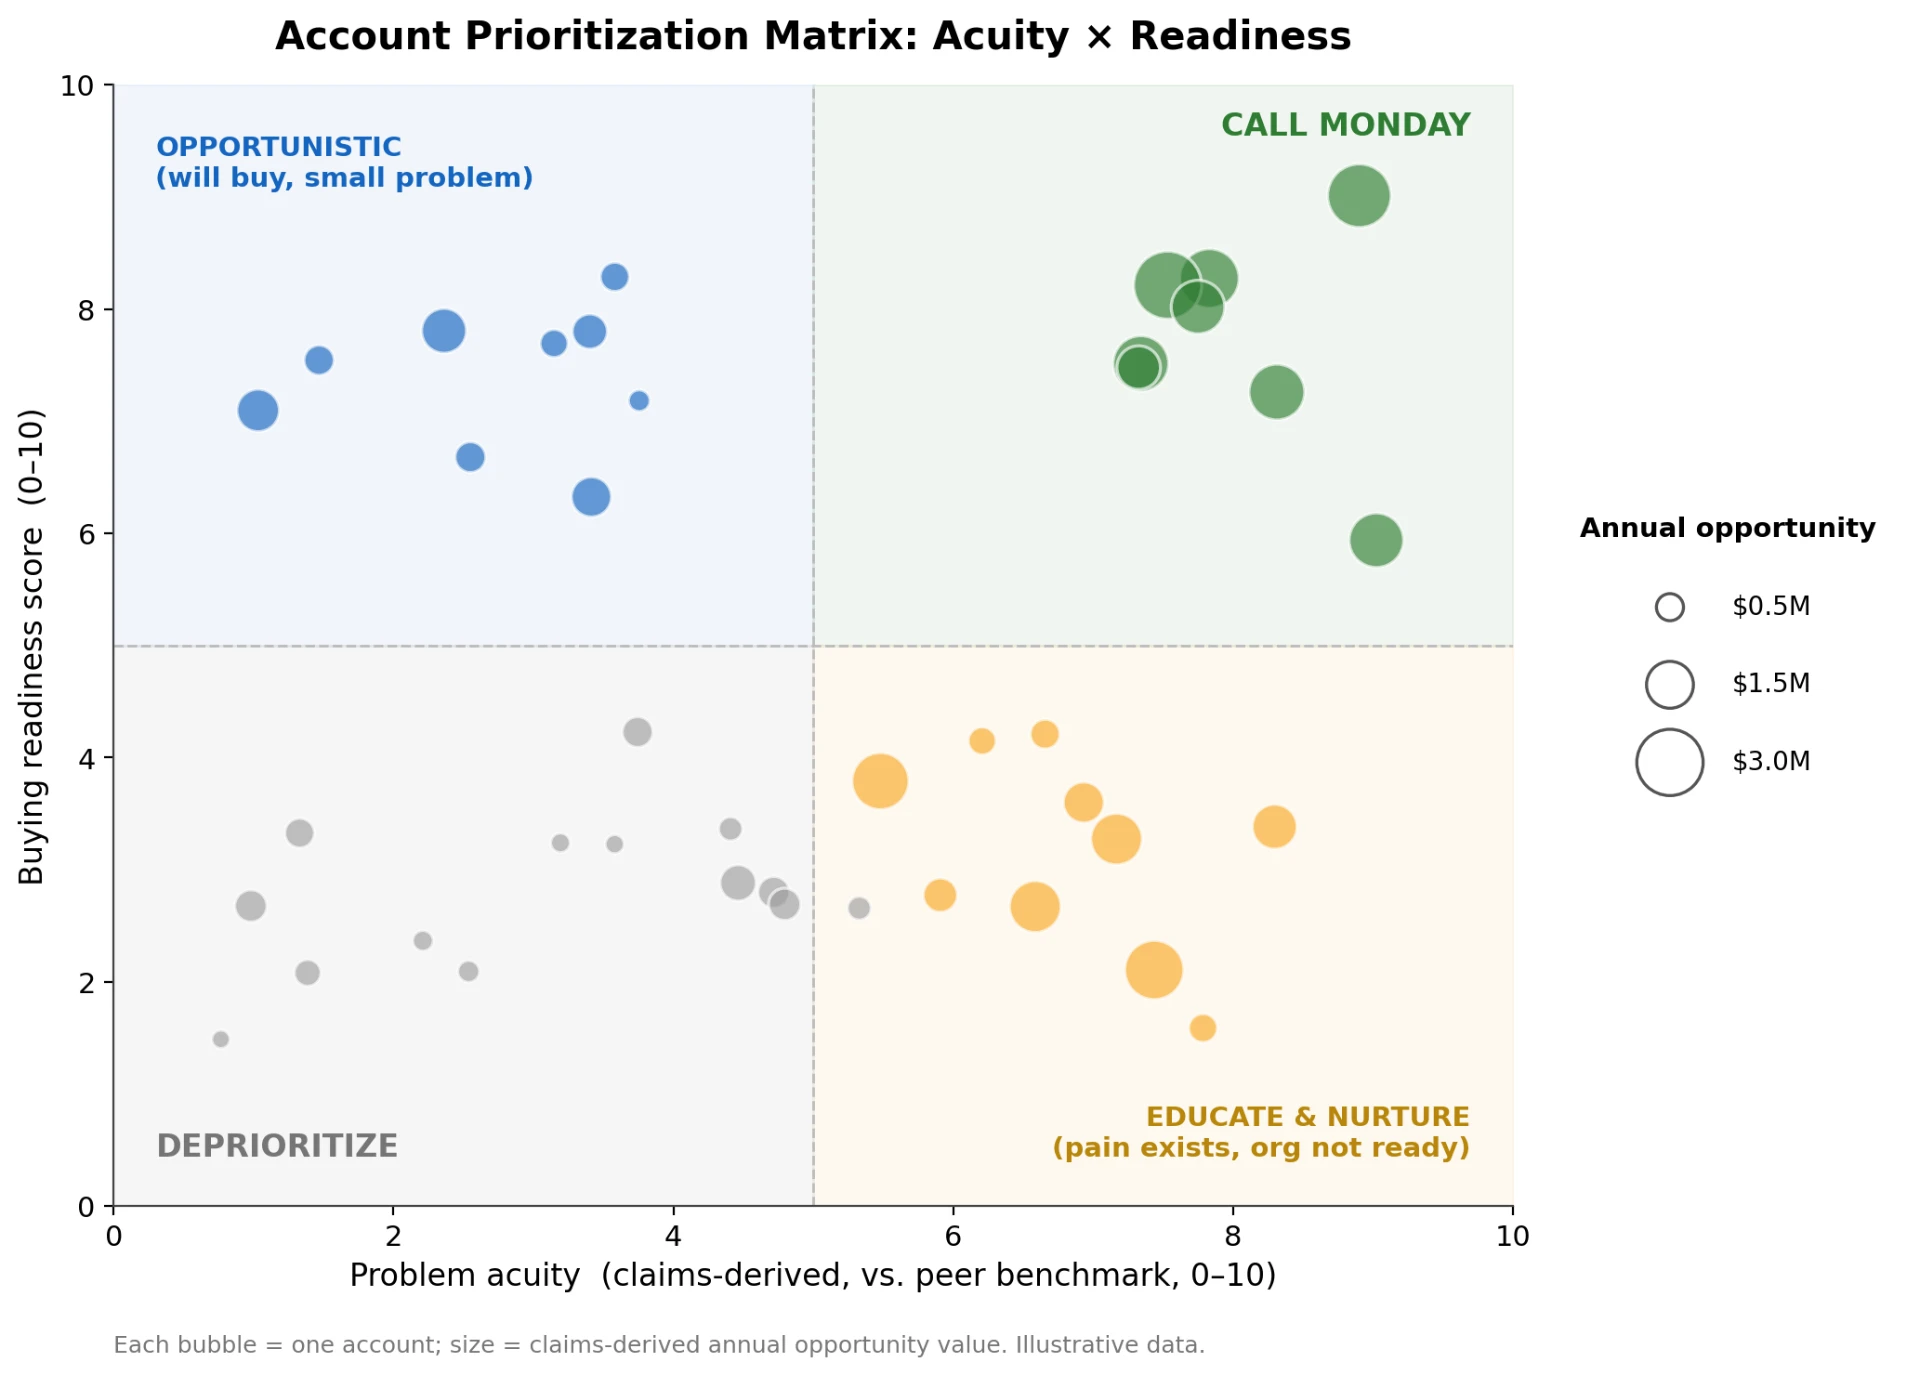
Two accounts with identical problem volume are not equal prospects. Score each on acuity (problem intensity relative to peers: a hospital at a high denial rate feels the pain; one at a low rate does not, at identical dollar volume) and readiness (signals that they buy solutions: tech stack maturity, value-based contract exposure, recent hires in the relevant function, prior vendor adoption). Acuity is in the claims; readiness is in the metadata around them.
5. Price the survivors
Multiply each surviving account's event volume by your realistic capture rate and unit economics. Sum it. That number, often 1 to 3% of the TAM slide, is your serviceable, obtainable market. It is the only number that should drive territory design, hiring, and fundraising narrative.
What the claims-derived market changes operationally
Sequencing. The ranked account list gives you an empirical answer to "who do we call first?": the accounts in the top decile of both acuity and readiness. In our experience these convert at a multiple of the median account's rate, close faster, and reference better, because the pain is real and current.
Messaging. When you know an account's specific claims profile, the first meeting changes from "here's our product" to "your denial rate in cardiology claims with Payer X appears to run well above your regional peers, here's what that is worth." That is not a pitch; it's a finding. Healthcare buyers, drowning in generic AI outreach, respond to findings.
Pricing. Event-level sizing supports event-level pricing. If you know the recoverable dollar volume per account, you can anchor price to a share of documented value rather than defending a per-seat fee against a procurement office.
Fundraising. A bottom-up market build survives diligence. Sophisticated healthcare investors now run exactly this analysis on portfolio candidates; showing up with it done, including the unflattering filtration losses, signals operational maturity that a TAM slide cannot.
The honest caveats
Claims data is powerful and imperfect. It lags (commercial datasets run months behind), it under-represents some settings, and entity resolution across billing identifiers, facilities, and parent systems is genuinely hard, so budget real effort for it. Public and licensed datasets each have coverage biases; know yours and state them. And claims tell you about the problem, not the politics: no dataset reveals that the CFO's cousin sells a competing product. Data-driven targeting narrows the field; humans still close.
The standard is not perfection. The standard is the alternative, and the alternative is a spreadsheet fantasy.
The bottom line
In healthcare, the market is not a number; it is a list. Claims data lets you build that list: which accounts have your problem, how acutely, whether you can reach them, and what each is worth. The output is a smaller market than your pitch deck claims and a far larger one than your pipeline currently reflects. Vendors who make this shift stop selling to a market and start selling to accounts, and in a sector where every sales cycle costs two quarters of runway, that is the difference between a GTM strategy and a GTM story.